
In one minute
We built the Opportunity Index as a business thriving indicator, combining quantitative rigour with real risk and business experience. It is not a “probability of failure” score. Instead, it measures whether a location’s underlying environment is structurally supportive or structurally challenging.
Here’s the key idea: if we can reliably identify the consistently low-performing places, then we also know that higher-scoring areas are, on average, statistically better places to operate. That is exactly what we see in the data.
What this means for you
We are not claiming to predict the fate of any single business. We are giving you a statistically grounded map of where the environment is more supportive for your business type, so your search starts from a stronger baseline.
To sanity-check this, we used strict evaluation techniques borrowed from quant departments at banks and capital markets (where the founders have more than 20 years of combined experience): out-of-sample testing, stability checks, and tail-risk concentration analysis.
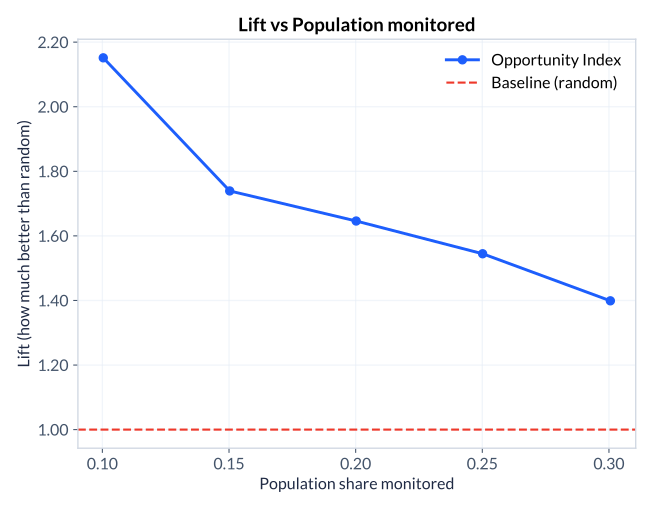
The chart on the left summarises the result. If closures were random, monitoring the worst 10% of locations would capture about 10% of closures. Instead, closures concentrate in the lowest-scoring areas: monitoring the worst 10% captures roughly 22% of closures, and the worst areas have around 2.5× higher closure risk. That strong “lower-tail” signal is the consistency check we want to pass.